Stop using the 'Device Category' in Google Analytics
Want to know exactly which version of your site users are seeing? Hint: You won't find the right answer in GA's 'Mobile Overview' report.
What's the problem?
Mobile devices have become increasingly popular, to the point Google now analyses the mobile version of a site for its SEO algorithms. Responsive design is now critical to any website.
Google Analytics (GA) provides a good starting point to see how your website performs on each device type. The report is found under, Audience > Mobile > Overview, and looks something like this:
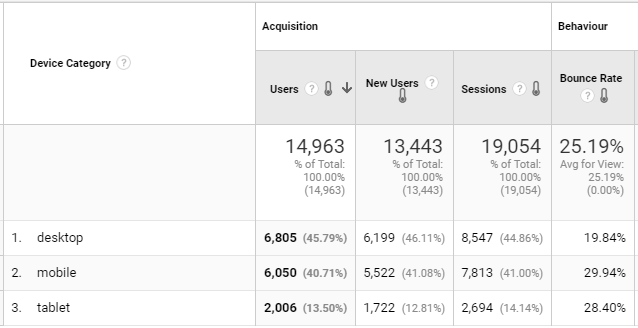
The categories above are great, but within each are dozens or possibly hundreds of individual devices. Their screen widths can vary massively. In a single category there could be several different responsive layouts. Each will perform differently.
Let's dig deeper
For responsive design to work, CSS media queries are used to amend the layout depending on the browser width.
The point at which a layout must change is called a breakpoint.
Example breakpoints:
- Up to 599px
- 600px - 899px
- 900px - 1199px
- 1200px - 1799px
- 1800px or over
Your site will use something similar.
If you don't know yours, you can ask your web developer for them. If you want to know more about which breakpoints to use, here's a handy guide.
With breakpoints, the design is based upon the screen width. In the example above there are 5 different breakpoints. In GA there are only 3 device categories. This means many breakpoint layouts will be seen on a single device type.
We need to know what they are.
Luckily there's a solution.
Before I show you how to do this yourself, here it is in action.
Below we can see 5 different breakpoints - just for mobile.
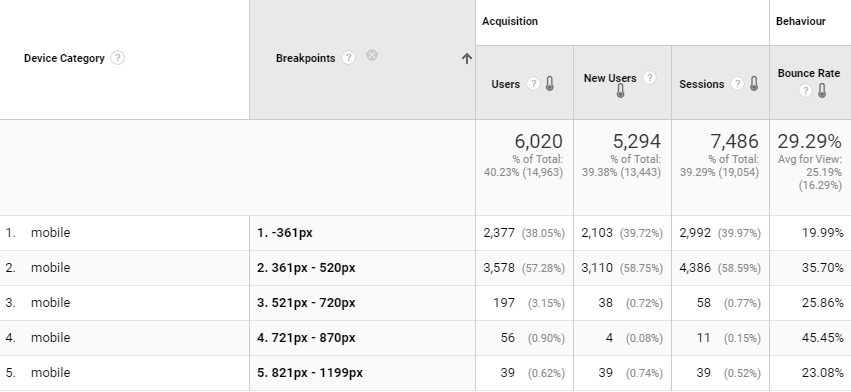
The bounce rate varies from 19.99% up to 45.45%. That's a significantly wide range. At the device category level we would only see 29.29% and be none the wiser about what's really going on.
More importantly, your ecommerce and goal conversion rates will be affected in the same way.
How to get breakpoint data into GA
Now you know the importance of analysing breakpoints rather than device types, let's get you all set up in GA.
The following tutorial uses Google Tag Manager (GTM). Your web developer could help if you're using the standard GA script.
Before getting started, ask your web developer for all of the breakpoints used on your site.
Let's begin:
- Open GTM
- Create a new 'Custom JavaScript' variable
- Call it something like 'JS - Breakpoints'
- Paste the code below into the variable:
function() { var width = window.innerWidth; if (width >= 1200) { return '6. >= 1200px'; } else if(width >= 871 && width <= 1199) { return '5. 871px - 1199px'; } else if(width >= 721 && width <= 870) { return '4. 721px - 870px'; } else if(width >= 521 && width <= 720) { return '3. 521px - 720px'; } else if(width >= 361 && width <= 520) { return '2. 361px - 520px'; } else if(width <= 360) { return '1. <= 361px'; } } - Change the numbers based on your breakpoints
- Save it
- In GA, go to 'Admin > Custom Definitions (in the middle column) > Custom Dimensions > New Custom Dimension'
- Enter a name e.g. 'Breakpoints'
- It's unlikely that a user's screen with change during their session but you never know, so keep 'Scope' as 'Hit'.
EDIT: Set the scope to 'Session' so metrics like bounce rate, avg session duration etc. are associated to the custom dimension. - Click 'Create'
- Click 'Done'
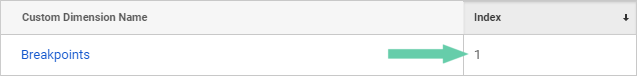
- You should now see your new custom dimension in the list. Make a note of the number in the 'Index' column.
- Back in GTM, go to your 'Google Analytics Settings' variable
If you're not using a 'Google Analytics Settings' variable, I highly recommend you do, it will save you a lot of time. Find out more in Simo Ahava's guide. - Under 'More Settings' click 'Custom Dimensions' then 'Add Custom Dimension'
- In the first field, named 'Index', enter the number from step 12
- In the second field, named 'Dimension Value', click the '+' icon to the right and select the 'JS - Breakpoints' variable
- Press Save
- Press Preview and check it comes through in preview mode and GA
If you're not sure the width of your current browser window, don't worry, I've created this tool to help with that. - Once you're happy it all works, publish the changes in GTM
How to see the breakpoint data in GA
The data has started flooding in, now to start using it.
You'll be able to see the breakpoints as a secondary dimension in all the standard GA reports. You can also create a custom report and use it as a primary dimension.
That's all there is to it.
If you've got any questions you'll find me on twitter @StuBowker.